Whatever way we’re spending time on mobile devices, one trend from 2013 is clear. Mobile is slowly eating away at our consumption of other forms of media. eMarketer predicts that this year, we’ll be spending more time on mobile (141 minutes) than any other form of media including PC, radio, and print, with the exception of television (for now). In fact, 79% of smartphone owners have their devices on their person for 22 of 24 hours in a day according to the IDC. This level of connectedness to our devices translates to a $12 billion opportunity cost for advertisers to capture the attention of mobile device owners.
However what do we really know about when people are actually engaging with their mobile devices? To answer this question, we dug through 300 million mobile ad impressions from the United States between August and September to answer the question of not only when, but also gain insight into “why” people were clicking on mobile ads when they do.
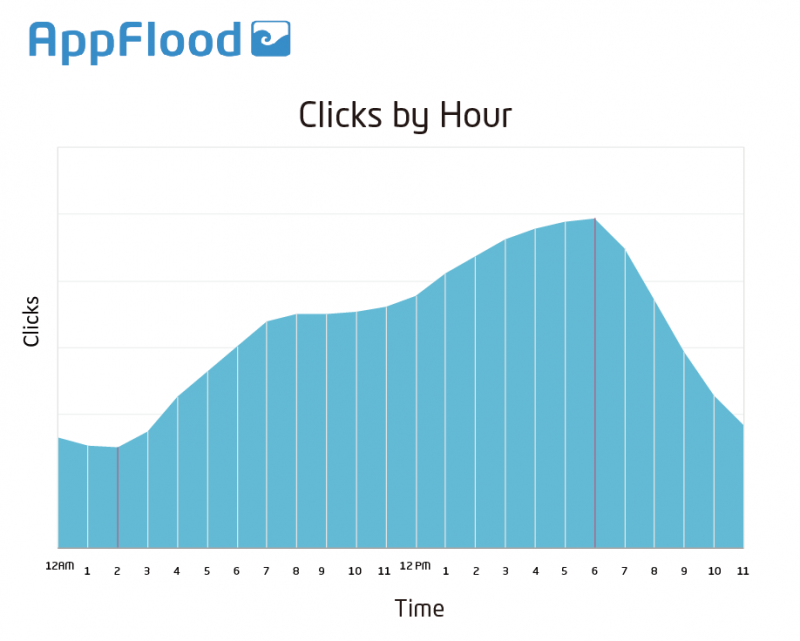
What hours are people most active?
If we take a look at the data below, you’ll notice that click activity parallels the restful and wakeful active hours within a person’s day. The volume of clicks on ads peaks at 6PM, suggesting that mobile device owners are the most active at this hour. For many of us the start of the evening is when we’re getting off of work and on our way home, whether by public or private transportation, and our commutes tend to double as a brief respite that we’ll spend gaming or reading the news on our devices.
Hourly click behavior
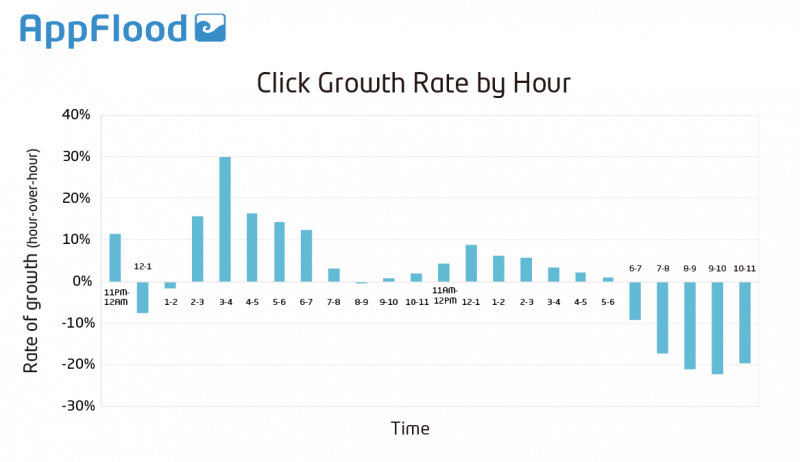
By looking at the same data set and analyzing the growth rate of clicks hour-by-hour as we’ve done with the chart below, we can identify a different set of insights that gives us a look into click behavior at specific hours during the day.
There’s a high drop off rate that starts after 6PM and lasts until 11PM, when click volume plummets a total of 62.7% within a span of five hours. However, between 11PM and 12AM, there’s a sudden 11.4% jump in clicks. We suspect that with as many as 54% of smartphone owners admitting that they check their phones while in bed, these users might be getting in their last hour of mobile leisure (and the discovery of new apps and brands) before dozing off between 12AM and 1AM. Then as the night wears on, it’s only an hour or two later that by 2AM we see the lowest volume of clicks in a day.
Weekday vs. weekend click trends
As much insight as we can derive from looking at average click volume and rates during the week, we broke down clicks by the days of the week and uncovered marked differences in click patterns between weekends and weekdays.
Comparing the weekday and weekend data sets separately, we can observe a more accurate analysis of mobile ad click behavior. Note the similarity between Saturday and Sunday weekend click patterns; and notice the similarities in the click patterns for Monday, Tuesday, Wednesday, Thursday, and Friday.
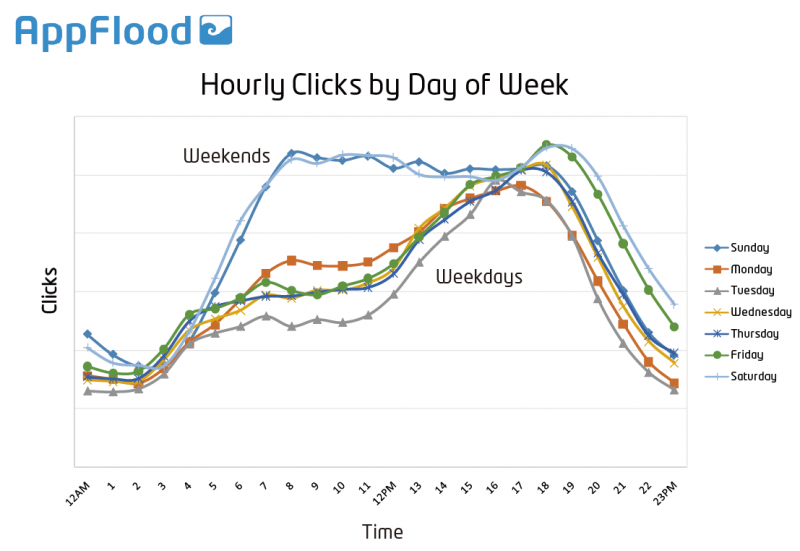
Weekday clicks closely resemble the average click trend that we observed in the first graph of average clicks by hour; during the weekday the lowest volume of clicks occur between 1AM and 2AM, while the most clicks occur starting at 6PM. Weekends on the other hand tell a different story.
With the weekends reserved for resting or relaxing, we’re able to see that people will spend more time on their mobile devices during Saturdays and Sundays; we can observe this trend in the data. A Saturday or Sunday on average will get 1.3x more clicks than any one weekday thanks to a longer period of high click activity that lasts between 8AM and 6PM. The largest volume of clicks during a 24 hour period occurs at 11AM. The lowest volume of clicks occurs between 2AM and 3AM.

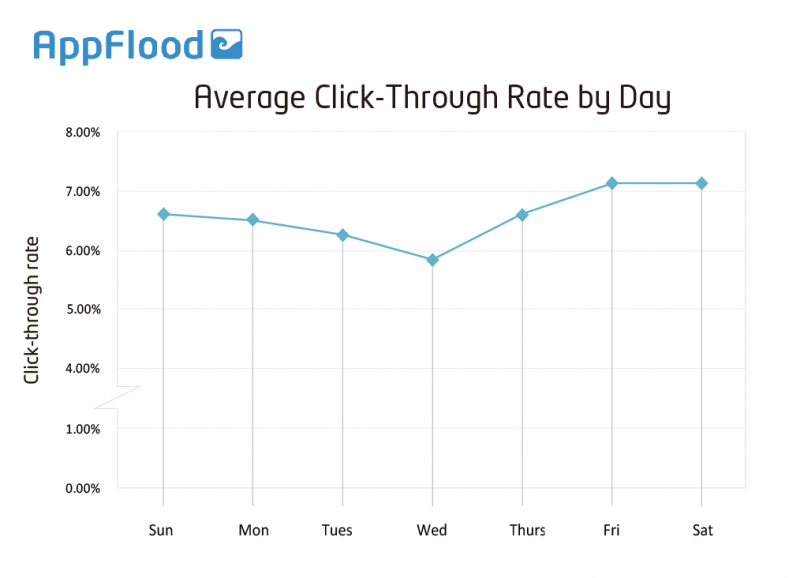
What days have the highest and lowest CTRs?
Now that we have a pretty good idea about when advertisers and publishers can expect people to be clicking on ads during the week and hour-by-hour, the question that advertisers might want answered is “when do clicks convert most frequently?”
We looked at CTRs on a day-by-day basis, and discovered that Wednesdays on average saw the lowest click-through rate with a 5.87% CTR. The highest CTRs on the other hand occurred on a Friday and Saturday both with a 7.17% CTR. Sundays followed with the second highest CTR at 6.65%.
Click behavior parallels daily routines
Based on AppFlood's click data, we can get an accurate and in-depth answer to the question of "when" or what hours and days mobile device owners tend to click on ads. Not surprisingly, the click behavior that we see here reflects hours of rest, work, and play. So if you ever ask yourself, "When do people click on or engage with ads" reflect on your usual daily or hourly routines, and there's a good chance that you'll find your answer.
